[Week 9] March 3+5 - Visualizing statistics
Section outline
-
 Presentations: Liza and Rebecca (Wednesday)
Discussion leaders: Maria and Alnura and Mihaly
Assigned reading:
Michael Friendly and Howard Wainer, "The golden age of statistical graphics," in A History of Data Visualization (2021).
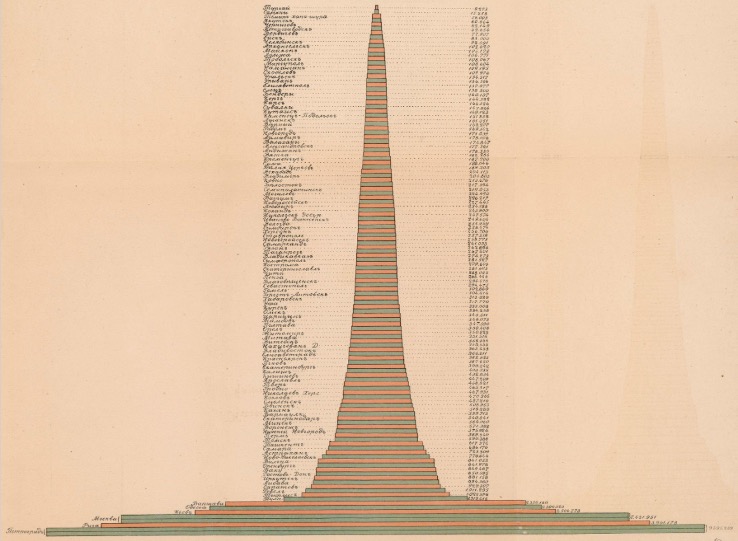
In class: some contemporary Central and East European examples...
Additional resources:
"Joint committee on standards for graphic presentation," Publications of the American Statistical Association 14 (1915): 790-797.
Willard C. Brinton, Graphical Methods for Presenting Facts (1919).
H. Gray Funkhouser, "Historical development of the graphical representation of statistical data," Osiris 3 (1937): 269-404. [JSTOR]
Histories of Data and the Database, special issue of Historical Studies in the Natural Sciences 48 no. 5 (2018). [JSTOR]
See the University of Oregon's site on The Time Charts of Joseph Priestley.
-
The Golden Age of statistical graphics
Uploaded 29/05/24, 12:34
-
